Traffic congestion is one of the major network problems in a mobile system. A high congestion deteriorates the overall performance of the network and should be minimized.
If the high traffic related to an occasional event, like sports event, fairs, conference, a temporary solution might be considered.
If there is a long-term growth the network capacity has to grow according to the demand.
The congestion analysis begins by identifying if there is only SDCCH or TCH congestion or both. Congestion on both SDCCH and TCH may mean that the only way to get rid of the congestion is to add more physical capacity in terms of transceivers or sites.
Consider how many channels that are allocated in the cell. If possible, expand the capacity with new transceivers, otherwise a new site must be implemented. Frequency planning schemes such as MRP and FLP could be used to relieve congestion. Microcells could be used to take traffic in severe congested areas.
SDCCH Congestion
In R8, the time congestion should be used instead of congestion based on access attempts as there is no way to estimate the number of access attempts a single mobile does.
Ericsson recommends using the SDCCH Time congestion as a KPI in R8. The formula is defined as:
SDCCH TIME CONGESTION OF TOTAL MEASUREMENT INTERVAL |
= |
CTCONGS |
X 100 % |
|
|
PERLEN * 60 |
|
|
where PERLEN is the measurement period in minutes.
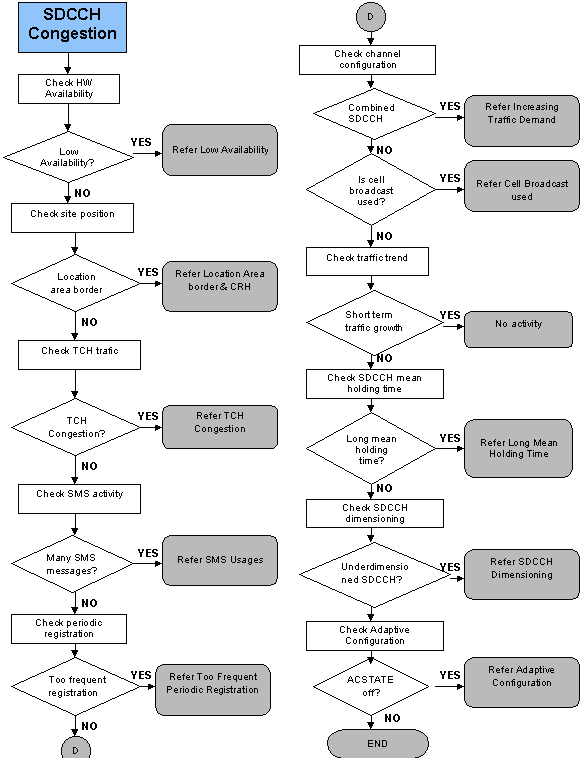
The flowchart below, Figure 51, explains a general approach to investigate SDCCH Congestion. The next section describes the action points in this flowchart. The reference to each action point is indicated on the flow chart as well.
